|
|
|
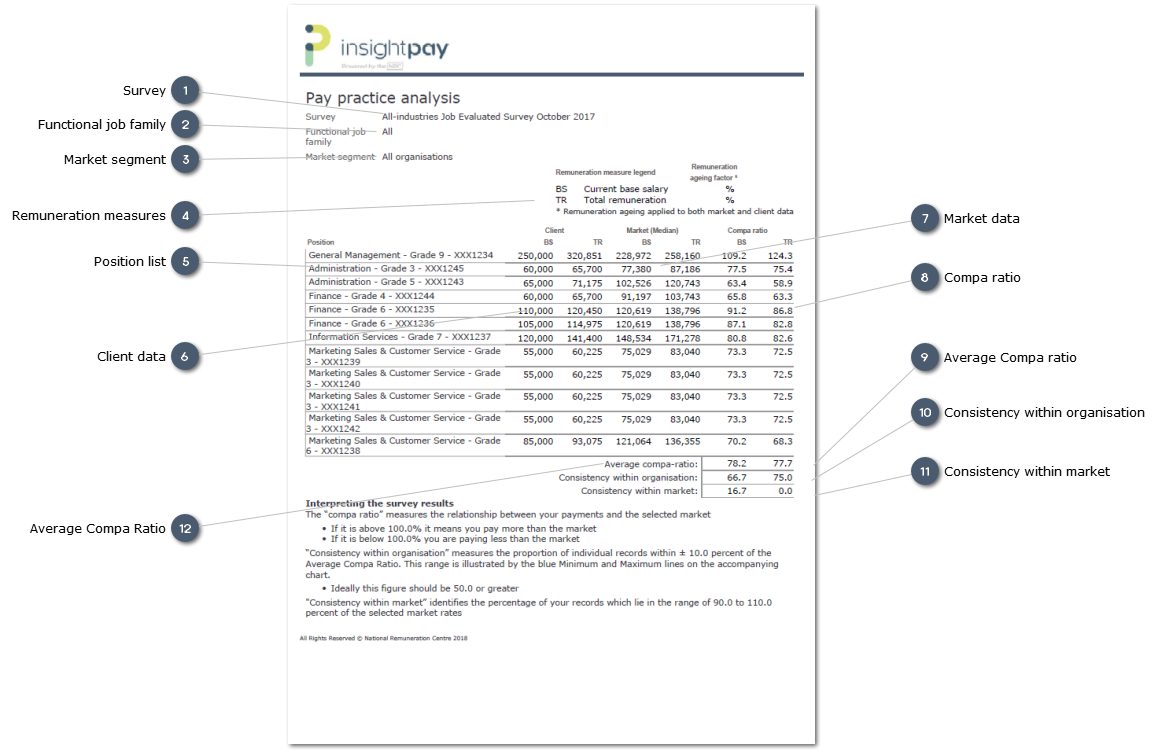
Example: Pay Practice Analysis
 SurveyDisplays selected survey
| |
 Functional job familyShows selected job family
| |
 Market segmentDisplays selected Market segment used for comparisons
| |
 Remuneration measures
Displays selected Remuneration measures used in report, and any aging factor applied to data.
| |
 Position listLists all records contributed by organisation, where there is enough data in the selected market segment for valid analysis.
| |
 Client dataShows the current remuneration levels for the employee based on the organisation input.
| |
 Market dataShows the comparative market data for the selected market segment and point of comparison.
The selected point of comparison is displayed in the column header (in this case "Median").
| |
 Compa ratioThe Compa ratio measures the relationship between the organisation remuneration and the selected market. The Compa ratio is expressed as a percentage.
-
If it is above 100.0 percent it means you are paying more than the selected market -
If it is below 100.0 percent it means you are paying less than the selected market.
While some variation is to be expected, for the majority of positions the comp ratio should lie between 90.0 and 110.0.
| |
 Average Compa ratioThe Average compa ratio is calculated from all the records included in the report. Ideally this should be close to 100.0, showing close alignment to the chosen market.
Note however that while the Average may show that overall an organisation's pay practice appears to be close to market practice, there may be wide variation in individual records, with very low Compa ratios being offset by very high ratios.
The two Consistency Indices discussed below put the average into context, by indicating how many records fall within an acceptable range of the organisation average.
| |
 Consistency within organisationThis index shows the proportion of records which fall within a range of 10.0 percent either side of the Average Compa Ratio. In the example the figure for Base Salary is 61.5. This means that 61.5 percent of the records have a Compa ratio which falls between 87.7.5 and 107.7.
For Total Remuneration the ratio is also 61.5.
While individual records will show variation in the Compa ratio the Consistency indices allow an assessment to be made on whether this has been achieved through consistent market alignment, or through wide variation and compensatory variations. An index of 50.0 percent or more suggests a high level of consistency.
| |
 Consistency within marketSimilar to the Consistency within organisation index, this index measures the consistency within the selected market, showing the proportion of records in which the Compa ratio falls between 90.0 and 110.0 percent of the market value.
Ideally the index would fall at 50.0 percent or higher. An index which is lower than this may require reconsideration of the selected market comparison, or adjustment of the market position chosen.
Alternatively it may simply be identifying a high level of anomalies and inconsistencies in your current alignment with the selected market, and require adjustments to remuneration practice to be made to address these.
| |
 Average Compa RatioThe average Compa Ratio for all records contributed by the organisation
| |
|
|
|
|