|
|
|
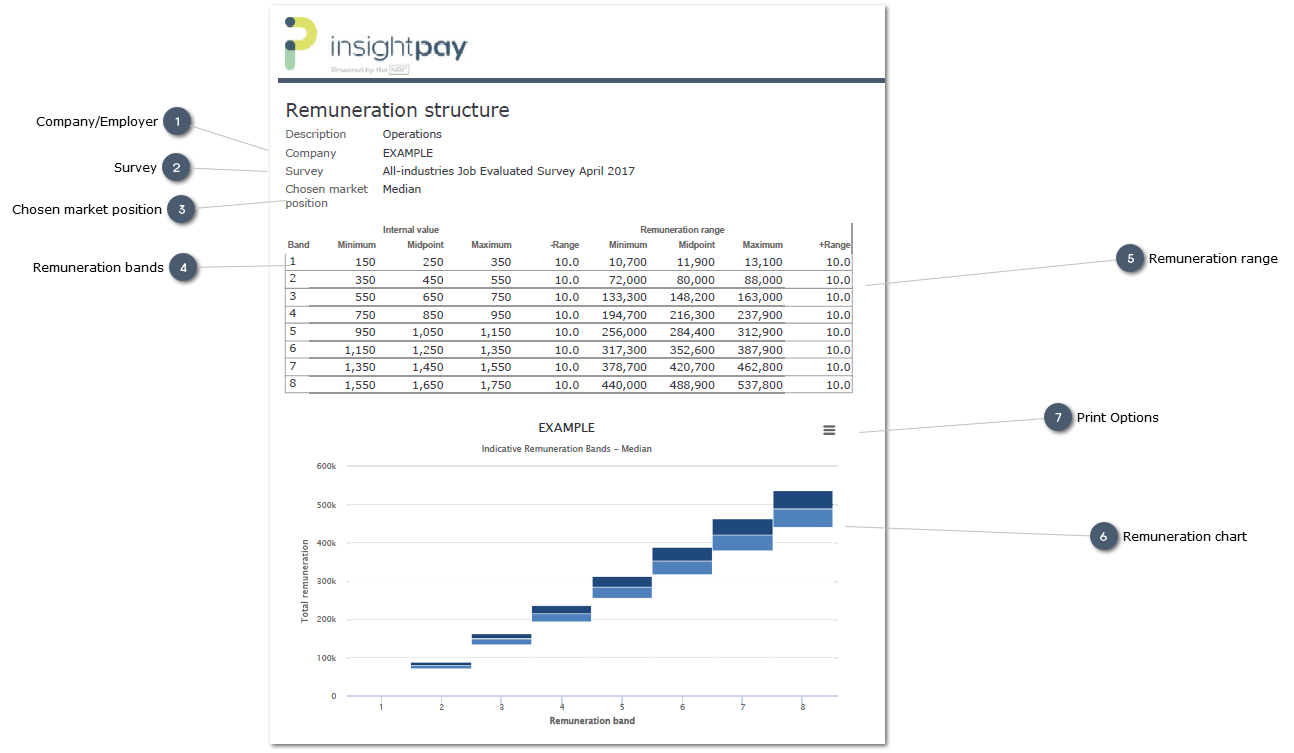
Example: Remuneration Structure
 Company/Employer
The name of the Company/Employer or subsidiary to wihch the remuneration structure applies
| |
 Survey
The survey from whihc data has been extracted to form the basis of the Remuneration structure
| |
 Chosen market positionThe market position on which the remuneration structure is based.
| |
 Remuneration bands
Table showing the calcualted Bands derived from the parameters selected.
To modify the structure after it has been generated, edit the Draft framework or the selected parameers adn regenerate the report.
| |
 Remuneration range
The calculated remuneration range for each band, comprising:
-
-
The percentage below the Midpoint at which the Minimum is calculated -
-
The Minimum remuneration value, defined by the -Range value -
-
The Midpoint vlaue is calculated directly fromt he Midpoint positns vlaue and the selected market data
-
-
The Maximum remuneration value, defined by the +Range value
-
-
The percentage above the Midpoint at which the Maximum is calculated
| |
 Remuneration chart
Chart illustrating the relationship between Bands.
This chart can be used to review structures, to help redefine rhe design of individual Bands, to ensure sensible progression between Bands.
It may be necessary to refine the Band structure by modifying points ranges or the values used to calculate the Minimum and Maximum of each Range.
Where proegression between Bands is desired, it may be useful to ensure there is a degree of overlap between neighbouring Bands, to mimimise any differential between current remuenration and remuneration in the new band. This may require modfifcation of the structre, by adding new bands, or varying the design of Bands to create an overlap.
| |
 Print Options
| |
|
|
|
|